Shaping Lift Curves
NOTE
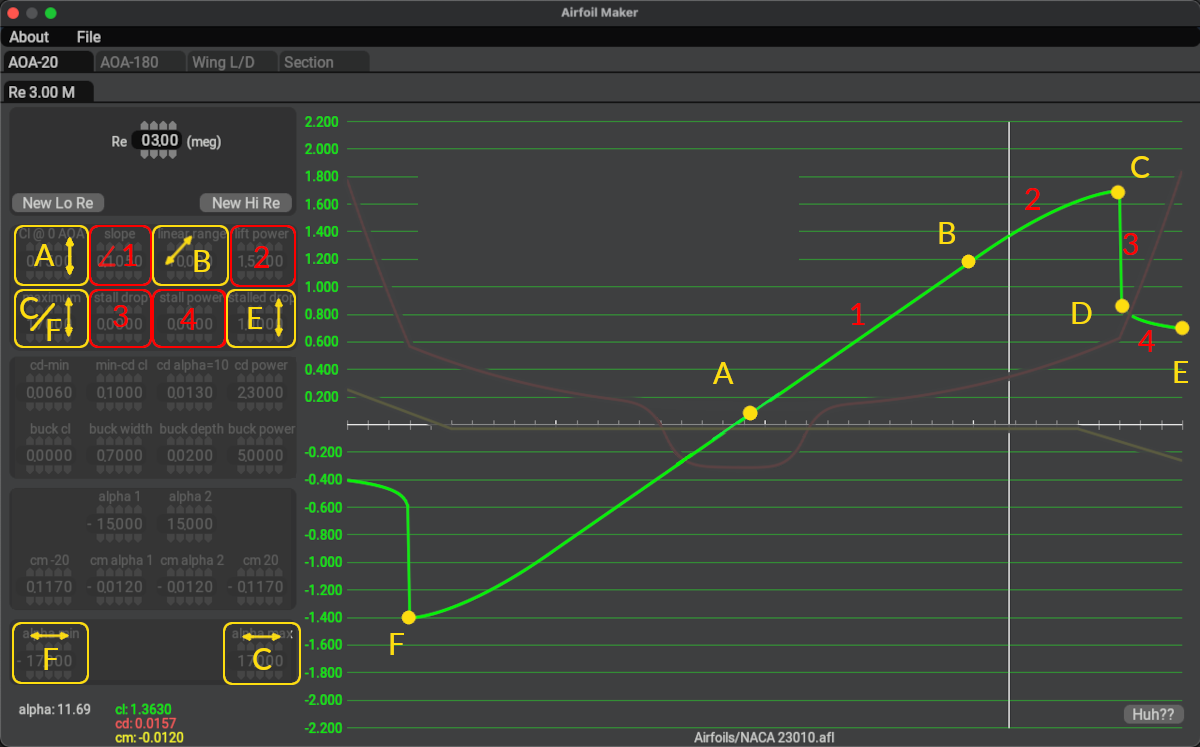
The image below contains overlay labels and highlights for clarification and learning purposes in this manual. Airfoil Maker does not contain such labels and colors on its GUI. You can hover over the widgets in the image below for tooltips on the various widget functions.
Lift curves are constructed about the 0º Alpha point as shown below (point A ) and consist of four equation segments on either side of this point. On the coefficient graph, segment endpoints are illustrated with yellow letters and segments labeled with red numbers. The colored boxes at left show which parameters affect which segment or endpoint. When applicable, an arrow is shown on the widget, indicating which direction the point will move when the parameter is changed. Parameters in Yellow will move the endpoints around, and values in red will change the length/shape of the segments.
For example, changing parameter A, which is the \(C_l\) at 0º Alpha will cause point A to shift up or down. Changing segment 3, the stall_drop parameter to a value of 0 will cause the vertical segment 3 to disappear (zero length) and point D to shift up and become coincident with point C.
For the power curve segments 2 and 4, a parameter value of 1 results in a straight line between the endpoints. Parameter values greater than 1 will bend the segment in one direction and values less than 1 will bend it in the opposite direction. The parameters widgets are ordered in such a way as to build the lift curve beginning at point A and working your way to point E. e.g. A1, B2, C3, etc. (point D is a derived value).
Once you've created the first set of curves, you can add new curve sets for differing Reynolds numbers by using the New Lo Re or New Hi Re buttons. You can hover the mouse over the widgets for tooltips regarding each parameter.