About Airfoil Maker
Airfoil Maker is an application for creating and editing airfoil files (*.afl) for X-Plane. Airfoil Maker does not calculate airfoil performance or pressure distributions around the airfoil, rather it is used to create lift, drag and moment coefficient curves that represent known airfoil performance established through other means, such as wind-tunnel testing or predictive output from an algorithmic airfoil analysis software like XFoil or XFL5.
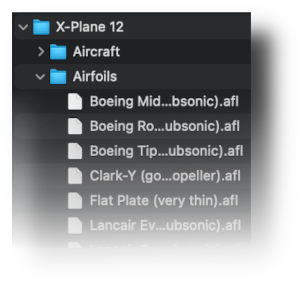
X-Plane ships with a generic set of airfoil files which cover a broad range of performance. These files are located in X-Plane's Airfoils folder. Airfoil files located in this folder are available to all aircraft when assigning airfoils to wings in PlaneMaker.
Optionally, you can create a folder called Airfoils in your own aircraft folder and place airfoil files there as well, in which case, those airfoils will only be available to that aircraft. It is common for aircraft authors to copy airfoil files from X-Plane's default location to their aircraft Airfoils folder as a starting point, and then modify the airfoil file further with Airfoil Maker.
X-Plane Airfoils
NOTE
The brief section that follows is by no means a discussion on the theory of airfoil sections, but rather only present the most basic of airfoil concepts that have relevancy when working with Airfoil Maker's configuration parameters and graphs. If you want to get further in-depth into airfoil section theory and performance, then seek out Theory of Wing Sections by Ira H. Abbott and Albert E. von Doenhoff, or similar aerodynamics text.
In addition, a very cool interactive simulator demonstrating airfoil behaviors can be found at the NASA link below:
NASA interactive airfoil simulator
Foil Characterization
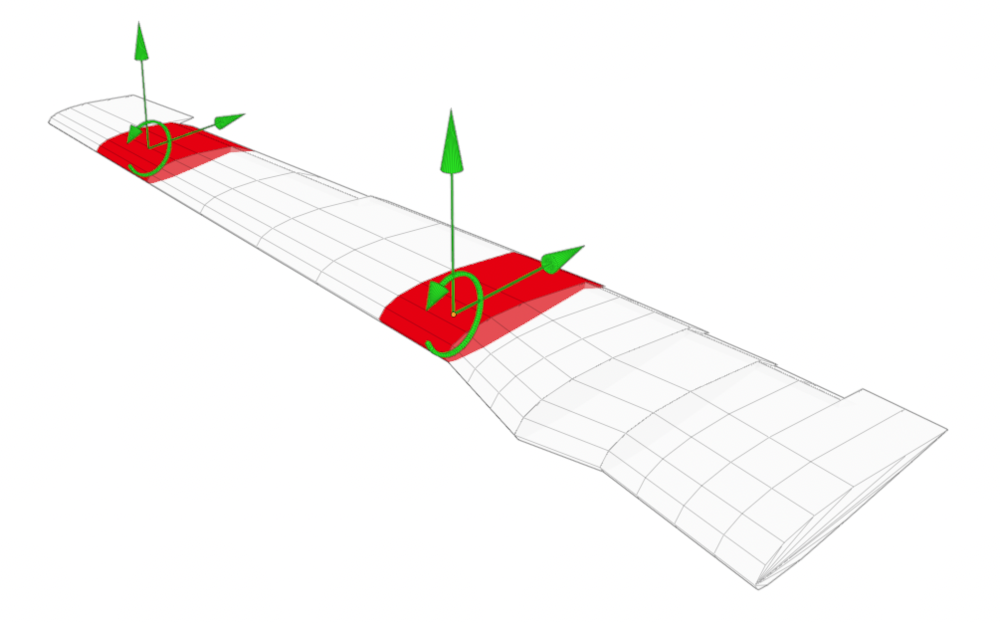
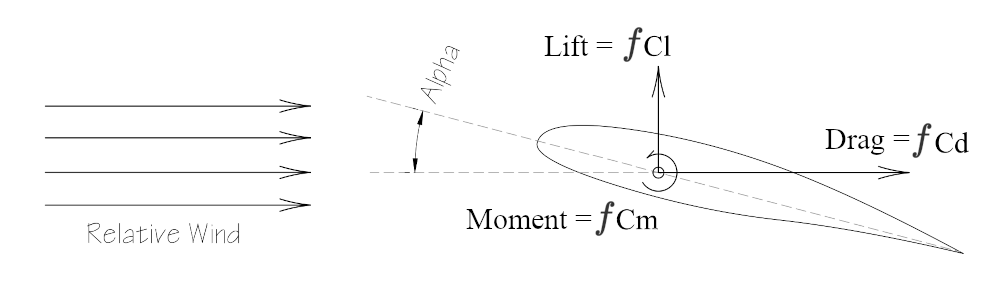
Airfoil performance is characterized by three forces which act on the airfoil section as air moves around it. Given a fixed airspeed and Alpha angle (Angle of Attack or AoA) of an airfoil, then a fixed Lift, Drag and Moment force will act on the airfoil, with these forces acting at approximately 25% of the chord length, measured from the leading edge (LE). This is illustrated below.
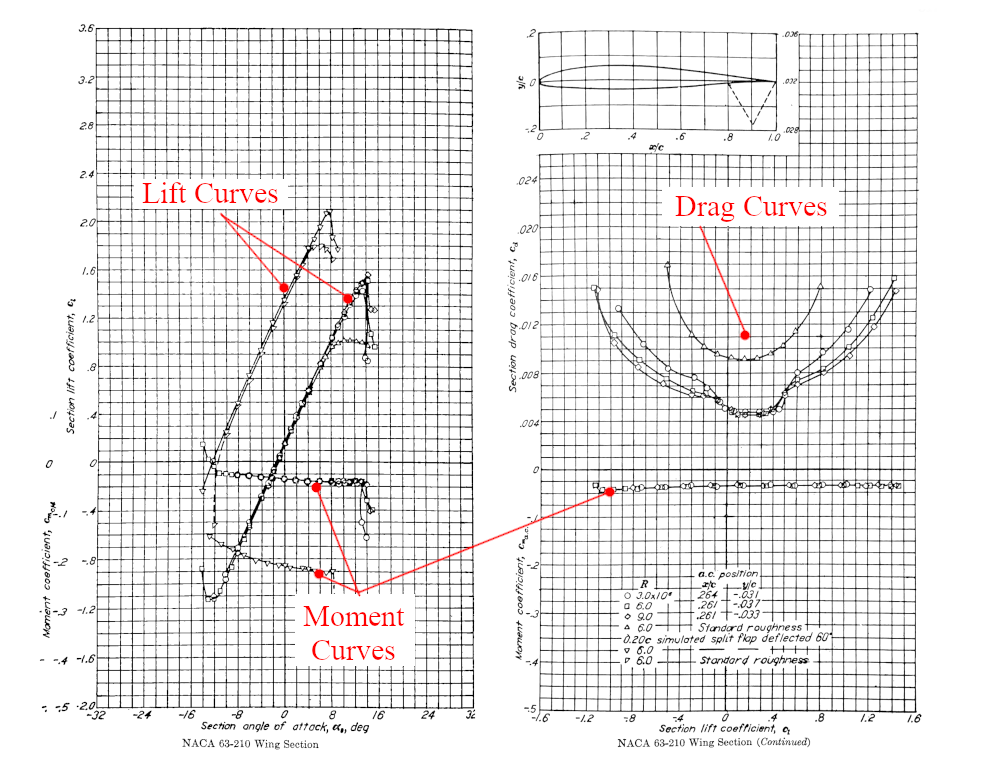
As the airspeed and AoA values are changed, the resulting Lift, Drag and Moment force on the airfoil will also change. This relationship between forces, airspeed and AoA can captured in what is called a coefficient graph, or coefficient curves. These curves may be generated from wind-tunnel test data, or algorithmically from airfoil analysis software, though some algorithmic methods are typically less accurate at higher AoAs. An example of these graphs/curves, generated from wind-tunnel tests, are shown below.
These curves do not contain the Lift/Drag/Moment forces themselves, as those ultimate force values are dependent upon other factors such as air density, airspeed and chord length. Rather, these coefficient curves utilize dimensionless coefficients. It is the dimensionless nature of these coefficients that allow smaller wind-tunnel models to accurately predict the behavior of their full size counterparts. The three primary coefficients for each of the forces are:
- Section Coefficient of Lift, denoted via the symbol: \(C_l\)
- Section Coefficient of Drag, denoted via the symbol: \(C_d\)
- Section Coefficient Moment, denoted via the symbol: \(C_m\)
When these coefficient values are plotted on a graph as a function of the the AoA of the section, they result in typical characteristic shapes. Lift curves are somewhat S-shaped, Drag curves U-shaped, and moment curves flat with bent ends. These general shapes can be seen in the curves above.
There are several sources online where these curves may be located for differing airfoil sections. One of the most popular sites is Airfoil Tools; however, the curves found on that site are generated algorithmically and not via Wind Tunnel testing. The most comprehensive source of classic airfoil coefficient graphs generated though Wind Tunnel testing can be found in the book "Theory of Wing Sections", which catalogs the many 4, 5 and 6 series NACA profiles developed between 1920 - 1940. For more modern, custom airfoil profiles developed by independent aerodynamicists or through Computational Fluid Dynamics (CFD), then that coefficient data might be a bit more difficult to track down, in which case the algorithmic analysis softwares like XFoil/XFLR5 could be used to generate the data, assuming the section profile coordinates are known. If wind-tunnel data for a profile is not on hand, then for most authors, the Airfoil Tools website is the first stop when looking for coefficient data.
To recap, Airfoil Maker is a tool to emulate these coefficient curve shapes parametrically. The Modeling Curves section further below describes how Airfoil Maker shapes these coefficient curves using piecewise equations and superposition techniques; however, a quick discussion on the Reynolds Number is in order first.
Reynolds Number
The Reynolds Number characterizes the effects of air viscosity on a section with regards to air speed and the chord length of the section. At lower Reynolds number values, Laminar flow is dominant, and at higher Reynolds number values, turbulent flow dominates, therefore the lift and drag characteristics of a foil section is very dependent upon the Reynolds number at that section at a given airspeed and AoA. The equation to calculate Reynolds number is given by:
where:
-
\(\rho\) = air density
-
\(V\) = reference Airspeed
-
\(L\) = Reference length (section chord length)
-
\(\mu\) = air viscosity
Because of the Reynolds number dependency on section chord length and airspeed, coefficient curves for the exact same foil profile, and at the exact same AoA, can have differing curve shapes. You can see this phenomena reflected in the example curves above, where there are groups of curves close together and similar in shape, but not exactly the same near stall angles. This is because each curve was generated at a unique airspeed / Reynolds Number. The "legend table" overlayed on the Drag Curve graph indicates the Reynolds Number (R) at which each curve was generated.
Click to Enlarge
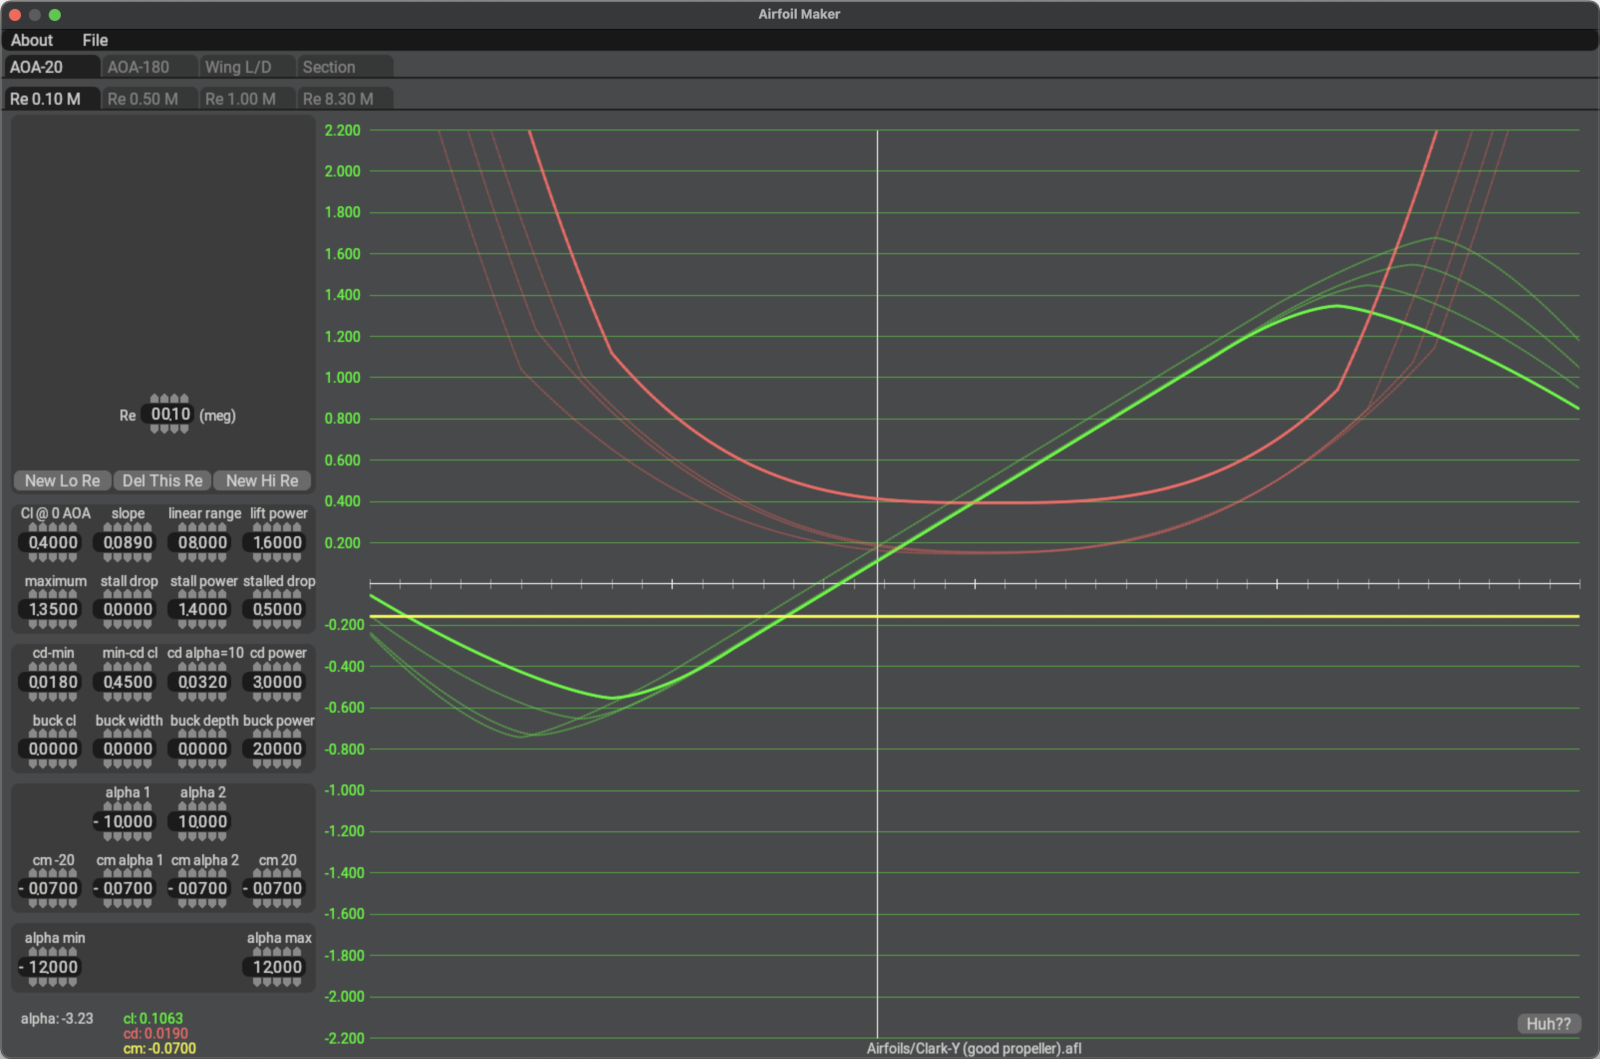
When creating a new airfoil, AirfoilMaker defaults to one set of coefficient curves for a Reynolds Number value of 4.5M; however, you can create additional coefficient curves at multiple Reynolds Numbers, which will result in a more accurate simulation across a broader range of airspeeds and AoAs, especially near stall AoAs. The screenshot at right shows an airfoil with 4 sets of curves at 4 differing Reynolds numbers. Airfoil Maker provides a dedicated tab for each unique Reynolds Number for which curves are created, with the curves for the active Reynolds number tab being highlighted and the others grayed out.
Small, model aircraft airfoils may operate at Reynolds numbers in the hundreds of thousands, while full size wings on small to mid-size GA aircraft operate at Reynolds numbers in the mid millions (3M - 6M). Very large aircraft with large wing chords like the B-2 operate at Reynolds numbers in the tens of millions. Higher airspeeds and longer airfoil chords result in larger Reynolds number operating points.
If you find the concept of the Reynolds number a bit confusing or unfamiliar, then you will be happy to know, that for recreational simulation at normal operating conditions, i.e. not around stall or really high AoAs, you can ignore multiple Reynolds numbers altogether and use the single default 4.5M value. Very good accuracy can still be obtained without touching the default Reynolds number at all!
If you have coefficient data at multiple Reynolds Number values though, then creating multiple curve sets at multiple Reynolds Number values will result in a more accurate simulation.
Modeling Curves
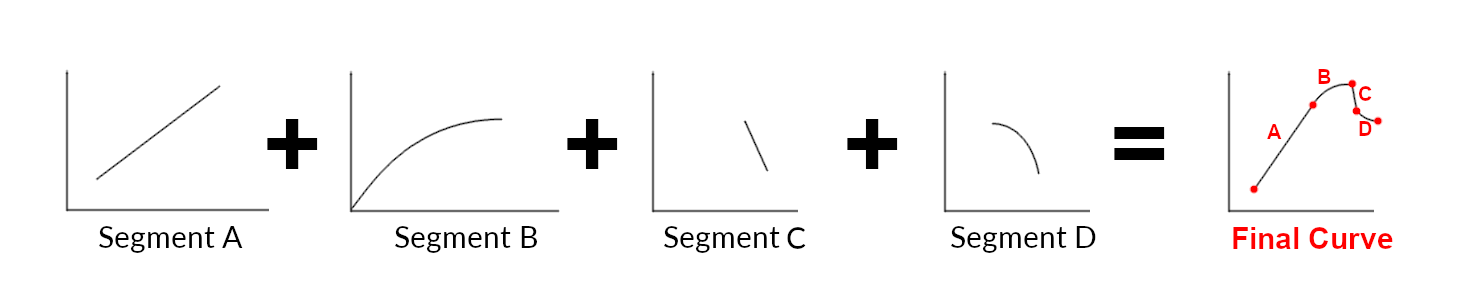
Before you get into editing the coefficient curve shapes, it may help to understand what Airfoil Maker is doing behind the scenes. Airfoil Maker emulates continuous Lift/Drag/Moment curves by combining finite segments of mathematical functions together, specifically linear interpolation and power equation functions. When you adjust the various numerical parameters to shape the curves, you are simply specifying equation coefficients, exponents and bounding values to individual segment equations, and Airfoil Maker is combining them to form the final, composite curve and graphing it. In some cases like the lift curve illustrated below, Airfoil Maker is sequencing the curve segments end to end and in others such as a Drag Curve Bucket, it is adding curves together via superposition. The image below illustrates the concept. The key to shaping the curves the way you desire is understanding how these equation segments are arranged and which numerical parameters affect which segments/endpoints. The following sections of this manual on each of the curve types describes each setting and its effect on the curves.
Coefficient Curve Use
In order to calculate the aerodynamic forces on a given wing element strip, X-Plane needs to know the AoA of the strip, the properties of the air flowing over the strip, and the element strip airfoil characteristics, which the coefficient curves provide. With this information, X-Plane calculates the lift, drag and moment forces on each element strip of the wing. By summing all the forces of all the wing element strips together, X-Plane calculates the total aerodynamic forces acting on the whole aircraft. Modeling the coefficient curves accurately across a broad range of Reynolds numbers is a powerful way to make your aircraft perform and feel more realistic in X-Plane.